Inference Distribution (Analytics)
This section outlines the process of comparing the distribution of inference data against the baseline established by training data. Understanding these distributions is essential for assessing model performance and identifying potential drifts or biases that may impact prediction accuracy.
Inference Data: Data used by the model to make predictions post-deployment, combined with the outputs for each of the processed predictions.
Training Data Baseline: The original dataset upon which the model was trained, serving as a benchmark for expected data distributions.
Requirements
Qwak automatically logs inference data to the Qwak Analytics Lake, which is later used for monitoring and data distribution. However, there are a few hard requirements for enabling the data Distribution dashboards for your model.
- The model should have a
ModelSchemadefined - The data in the ModelSchema should be numerical or categorical
Distribution is being charted both on inference-only data, as well as comparing inference with the training baseline data. For the latter is mandatory to log your training dataset as a Pandas Dataframe to the Qwak Registry during your Build process.
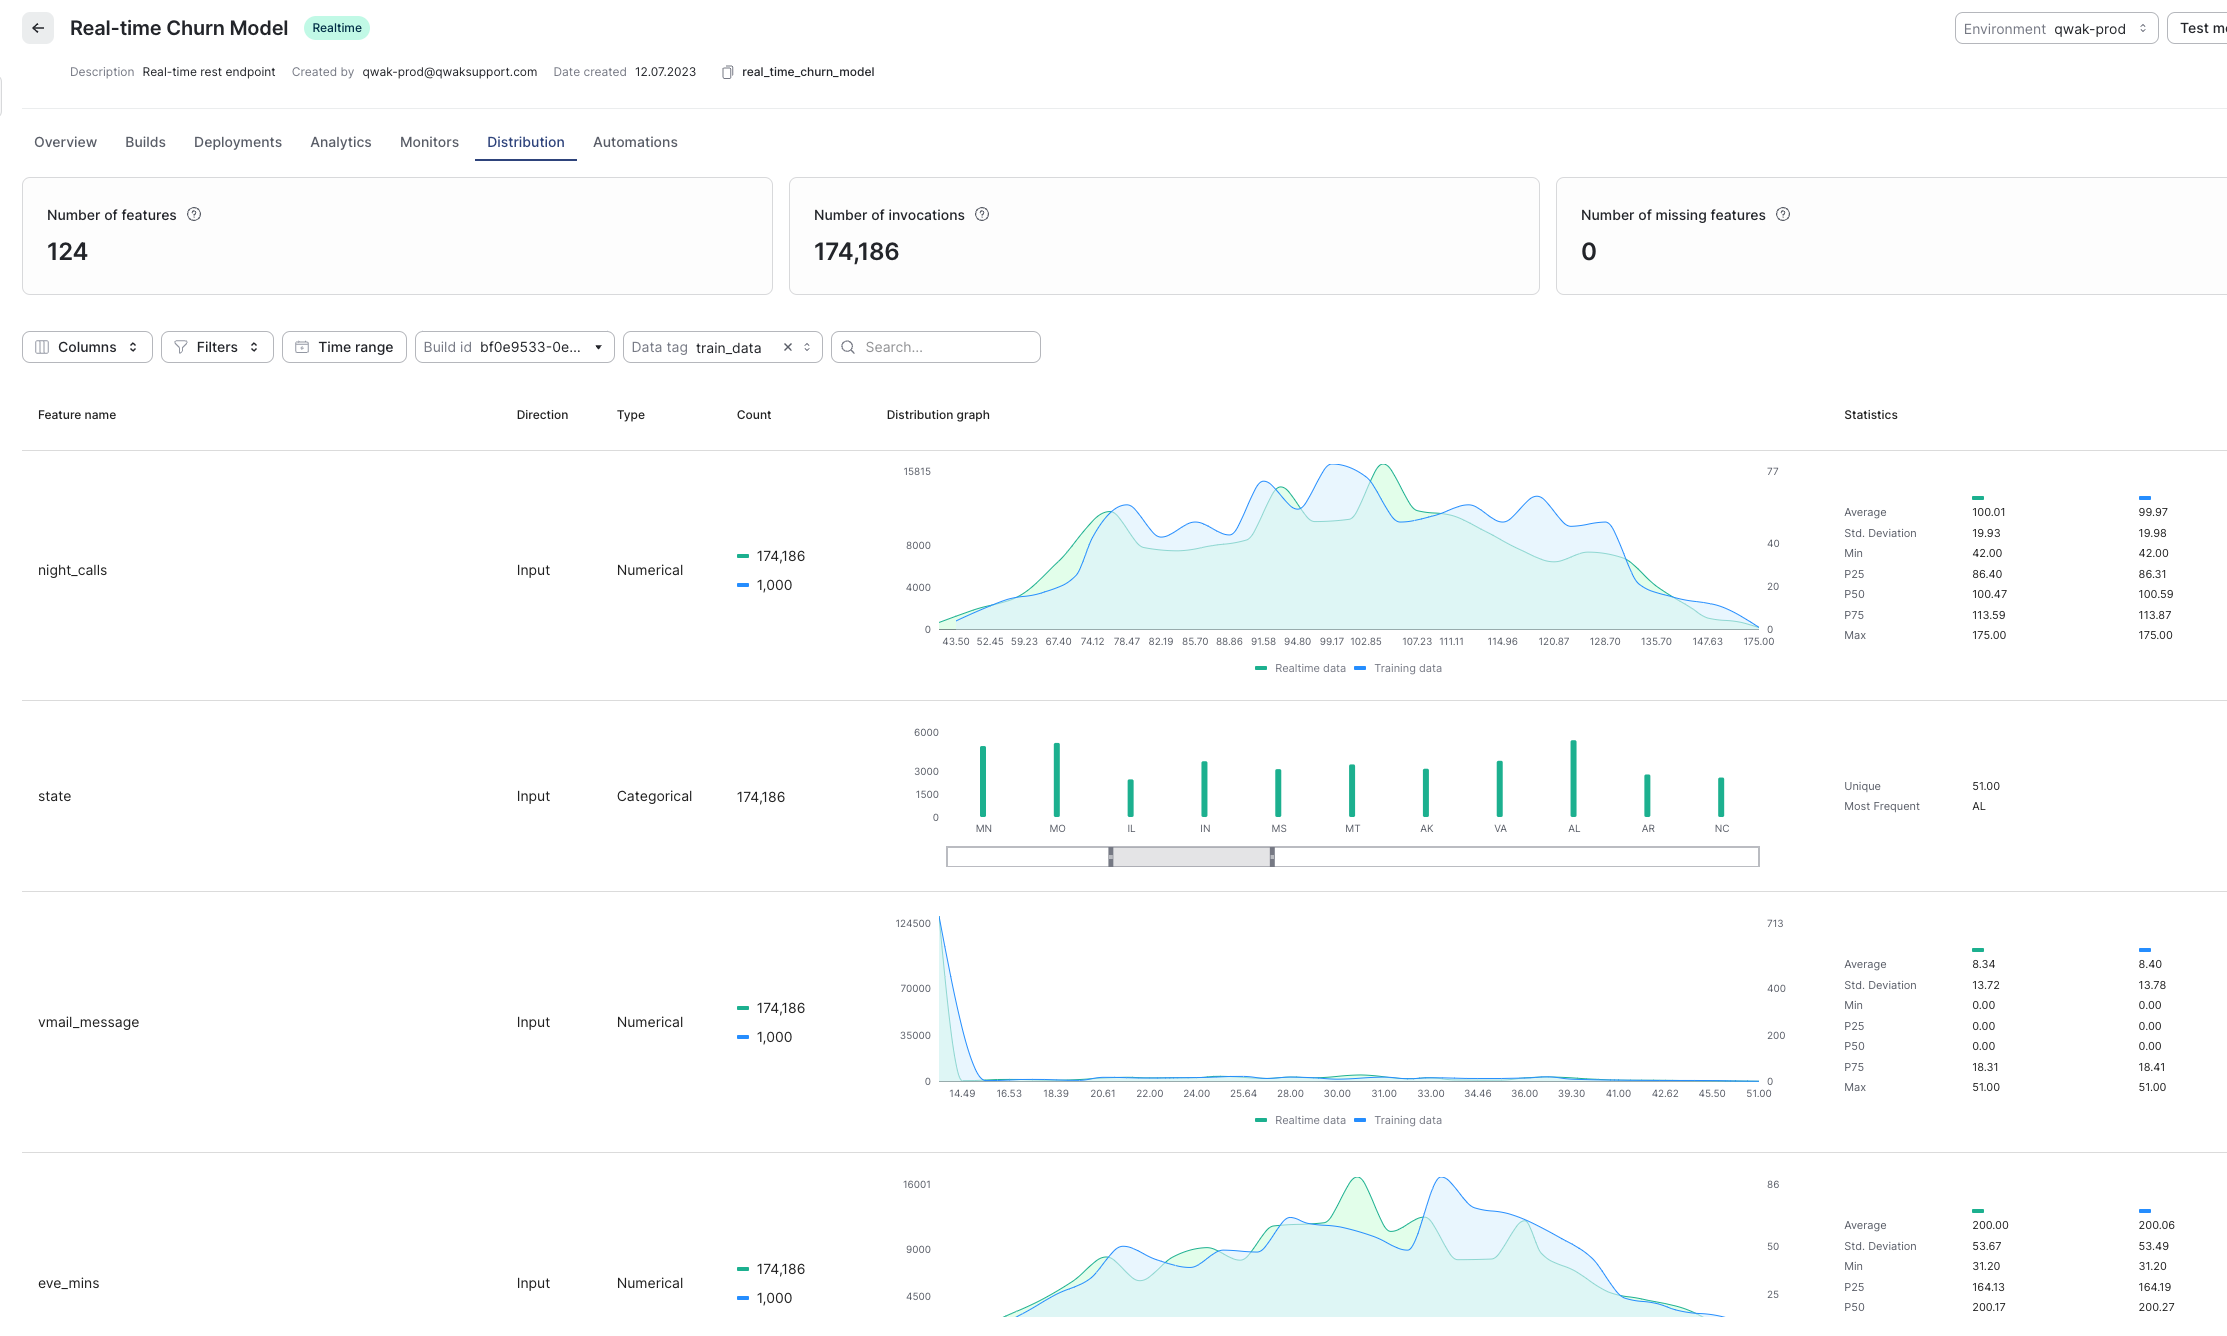
Inference Data vs. Training Baselines
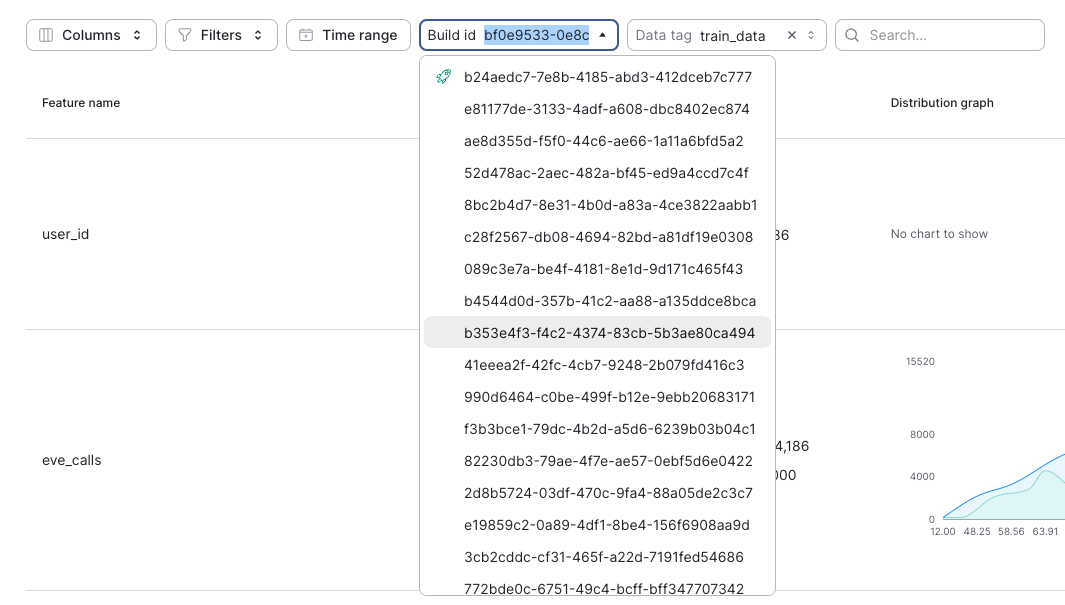
In order to compare inference data with training data please select the relevant build from Build ID in the UI and the relevant Dataframe that was previously logged and tagged, under theData tag dropdown.
Example dashboard:
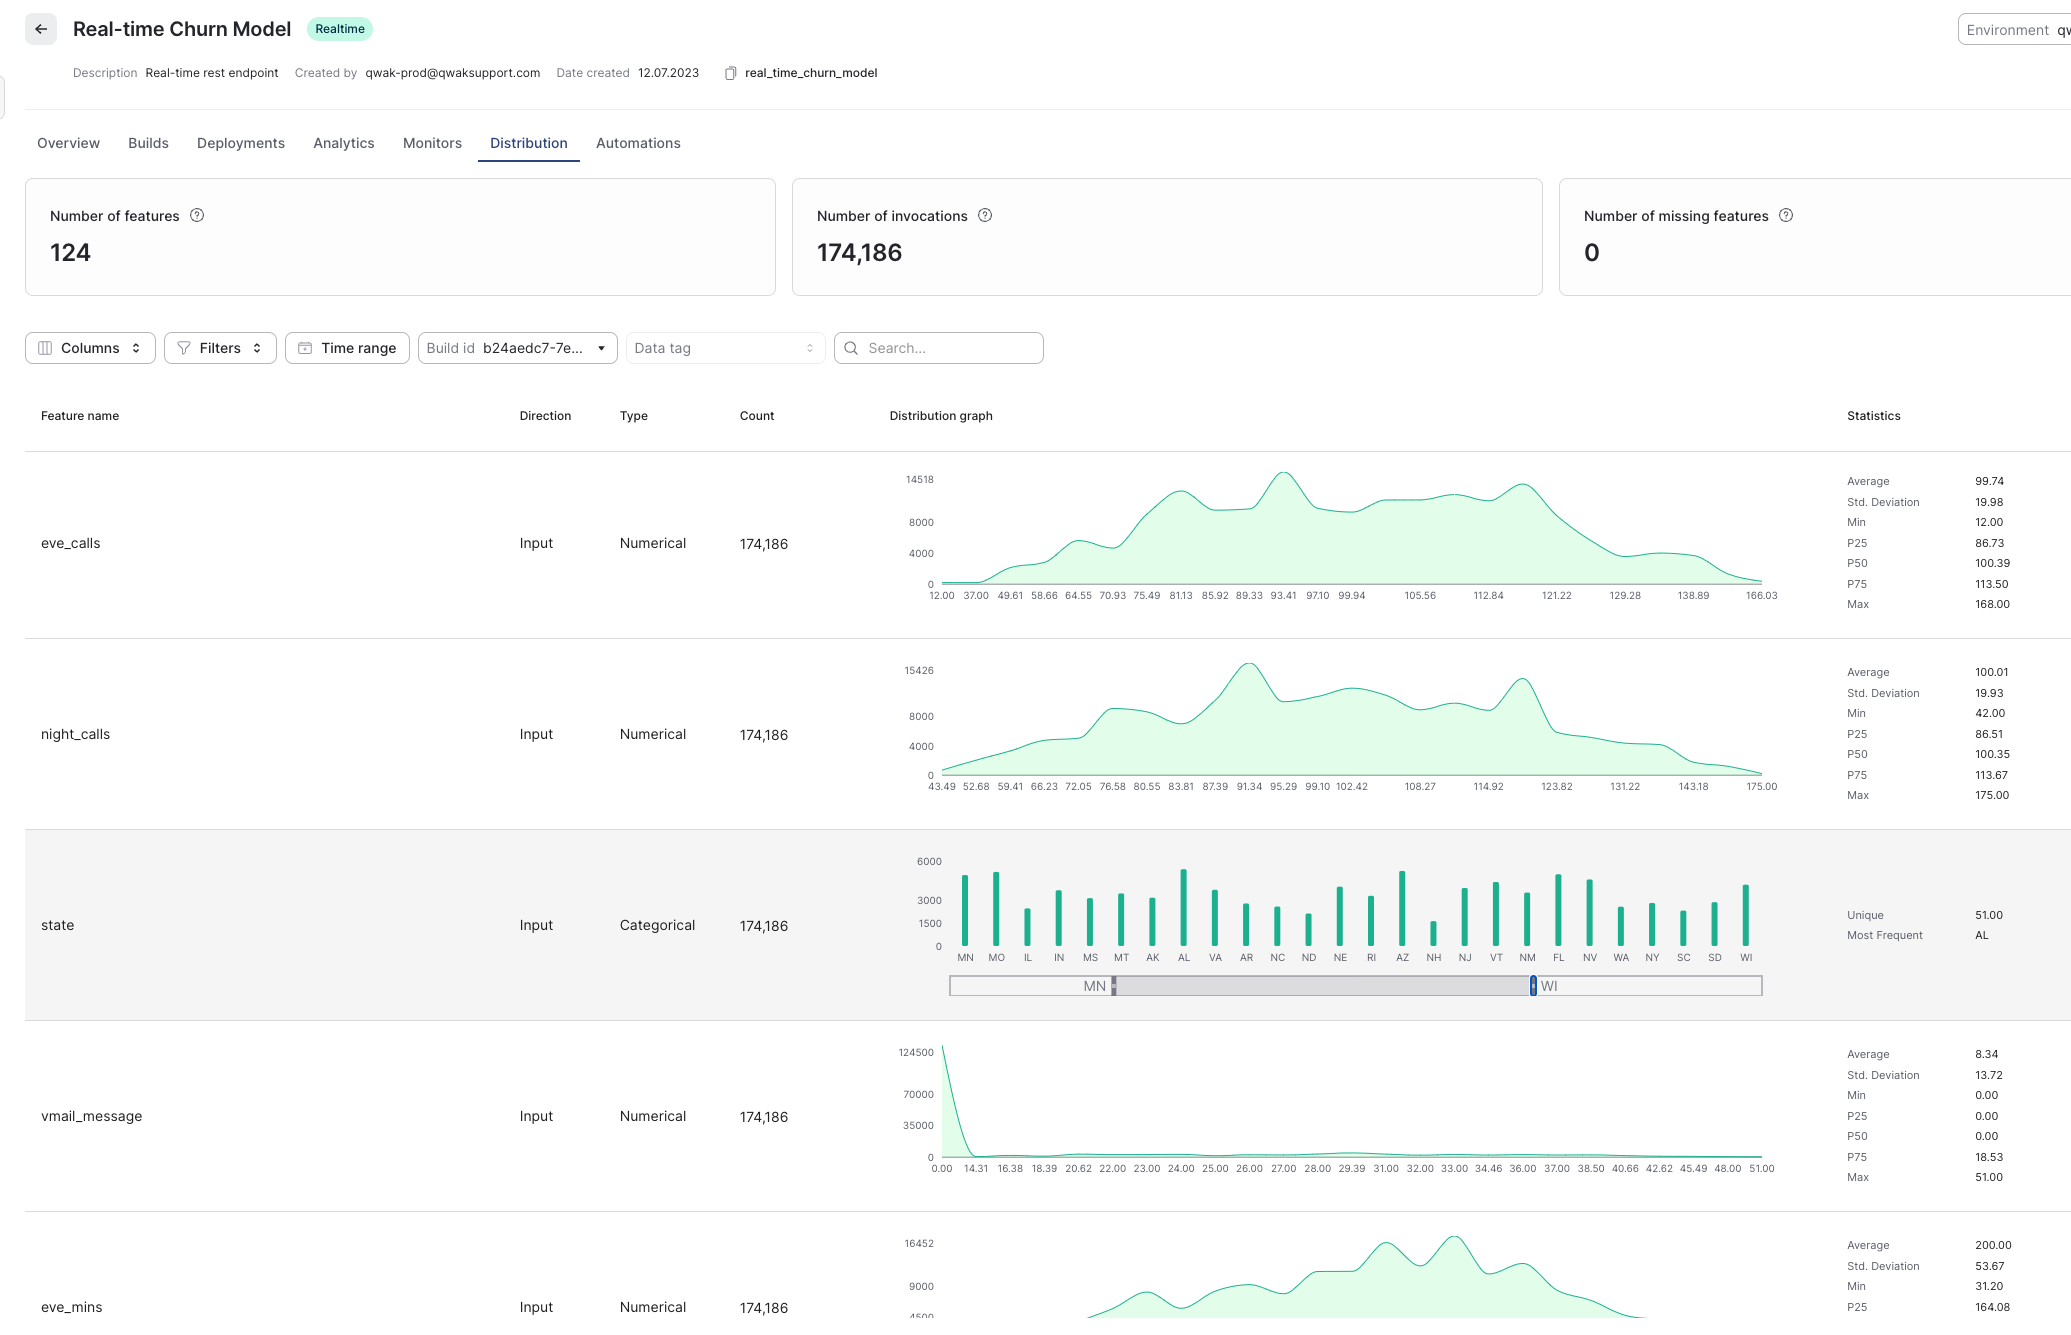
Inference-Only Data
Example dashboard:
Available Statistics
Average (Mean)
The mean is the average of all numbers in a dataset. It's calculated by summing all values and dividing by the number of values. The mean provides a central location for the data. The mean is used to find the central tendency of the data. It's sensitive to outliers, meaning that extreme values can significantly affect it.
Standard Deviation (Std. Deviation)
Standard deviation measures the amount of variation or dispersion of a set of values. A low standard deviation indicates that the values tend to be close to the mean, whereas a high standard deviation indicates that the values are spread out over a wider range. It's used to quantify the amount of variability or spread in a set of data values. It helps in understanding how much the data deviates from the average.
Minimum (Min)
The minimum is the smallest number in a dataset. It helps in identifying the lower boundary of the data distribution, enabling the understanding of data range and detecting outliers.
25th Percentile (P25)
The 25th percentile (also known as the first quartile) is the value below which 25% of the observations in a dataset fall. It marks the lower quartile of the data. It's used to understand the distribution of data by dividing the dataset into four equal parts. The 25th percentile gives insights into the lower end of the data distribution, excluding the lowest outliers.
50th Percentile (Median, P50)
The 50th percentile, or median, is the middle value of a dataset when it is ordered in ascending or descending order. If there is an even number of observations, the median is the average of the two middle numbers. The median is a measure of central tendency that is less sensitive to outliers compared to the mean. It effectively represents the middle of a dataset.
75th Percentile (P75)
The 75th percentile (also known as the third quartile) is the value below which 75% of the observations in a dataset fall. It marks the upper quartile of the data. Similar to the 25th percentile but for the upper end of the data distribution, it helps in understanding the distribution above the median. It is useful for identifying the range within which the bulk of the data points lie, excluding the highest outliers.
Maximum (Max)
The maximum is the largest number in a dataset. It provides the upper boundary of the data distribution, allowing for the assessment of the data range and the detection of outliers.
Please note that the inference distribution charts do not incorporate data from
FeatureStoreInput. To view this data, please refer to the Feature Set page where your model retrieves its inference data.
Updated 5 months ago